The graph shows saving supply and investment demand curves. In panel A, saving represents the supply of loanable funds. In Panel B, investment represents the demand for loanable funds. What is NOT true about these curves? 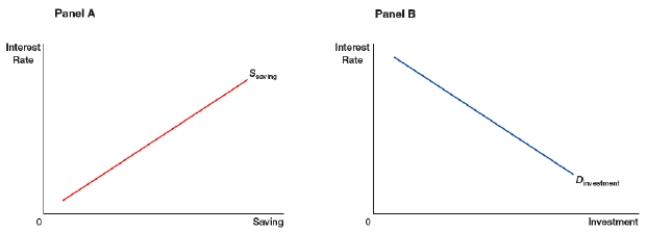
A) An increase in interest rates increases the quantity of saving supplied.
B) The quantity of saving is negatively related to the interest rate.
C) A decrease in interest rates increases the quantity of investment demanded.
D) The quantity of investment is negatively related to the interest rate.
Correct Answer:
Verified
Q40: In the market for loanable funds, the
Q41: In the market for loanable funds, the
Q42: Investors are willing to borrow investments funds
Q43: In the market for loanable funds, the
Q44: Katia is considering whether to buy a
Q46: The graph shows saving supply and investment
Q47: If demand increases in the market for
Q48: If supply increases in the market for
Q49: If demand decreases in the market for
Q50: If supply decreases in the market for
Unlock this Answer For Free Now!
View this answer and more for free by performing one of the following actions

Scan the QR code to install the App and get 2 free unlocks

Unlock quizzes for free by uploading documents