The graph shows a shift in investment demand to the right. This would MOST LIKELY occur: 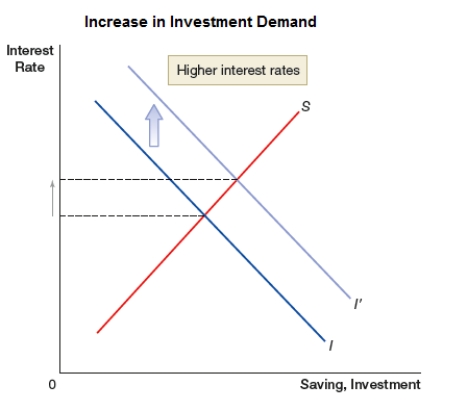
A) during a recession.
B) during an economic boom.
C) in case of a decline in investor confidence.
D) in case of higher taxes imposed on business profits.
Correct Answer:
Verified
Q58: Marginal analysis indicates that an additional investment
Q59: Lower saving has what impact on the
Q60: Higher saving has what impact on the
Q61: The market interest rate is determined by
Q62: The market interest rate is determined by
Q64: The graph shows a shift in investment
Q65: The graph shows a shift in saving
Q66: The graph shows a shift in saving
Q67: One purpose of the 2018 reduction in
Q68: Which of the following is one of
Unlock this Answer For Free Now!
View this answer and more for free by performing one of the following actions

Scan the QR code to install the App and get 2 free unlocks

Unlock quizzes for free by uploading documents