The graphs show Japanese demographics in 1960, 2020, and 2050. Which statement is NOT correct about these graphs? 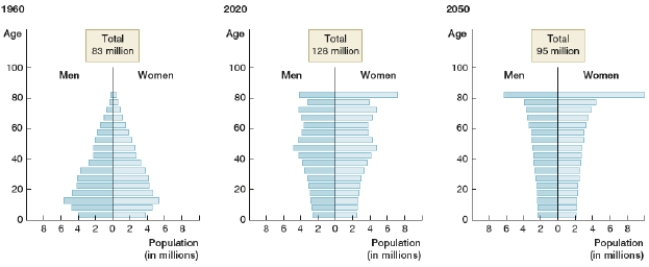
A) In 2050, the number of people in their 80's is predicted to be greater than the number of people in their 20's.
B) In 1960, there were more babies in Japan than there are predicted to be in 2050.
C) The population in Japan is predicted to decrease after 2020.
D) The predicted number of retirees in 2050 is less than the number of retirees in 1960.
Correct Answer:
Verified
Q75: U.S. law regarding the debt ceiling states
Q76: Which is NOT a concern about the
Q77: Predictions regarding U.S. national debt are that
Q78: A major concern about the rising transfer
Q79: The histogram shows the number of U.S.
Q81: How does a country's national debt compare
Q82: What two things can cause a country's
Q83: What two things can cause a country's
Q84: Concerns over rising U.S. national debt include
Q85: Changing demographics in the U.S. population are
Unlock this Answer For Free Now!
View this answer and more for free by performing one of the following actions

Scan the QR code to install the App and get 2 free unlocks

Unlock quizzes for free by uploading documents