The histogram below shows real GDP per capita and the economic growth for select countries between 1913 and 2016. Which country had the least economic growth? 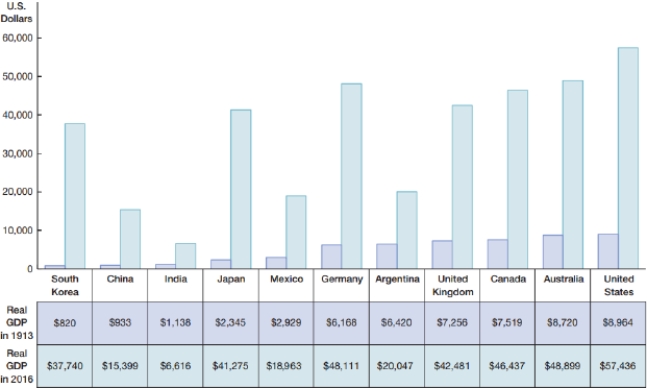
A) China
B) Mexico
C) India
D) Argentina
Correct Answer:
Verified
Q10: (Table 2: Economic and Population Data
Q11: (Table 3: Economic Data for Countries
Q12: (Table 3: Economic Data for Countries
Q13: (Table 3: Economic Data for Countries
Q14: The histogram below shows real GDP per
Q16: According to the rule of 70, how
Q17: According to the rule of 70, what
Q18: According to the rule of 70, what
Q19: What is the formula to calculate doubling
Q20: According to the rule of 70, how
Unlock this Answer For Free Now!
View this answer and more for free by performing one of the following actions

Scan the QR code to install the App and get 2 free unlocks

Unlock quizzes for free by uploading documents