(Figure: Maximum Profit in Perfect Competition) In the figure, the curve represented by C is the _____ curve.
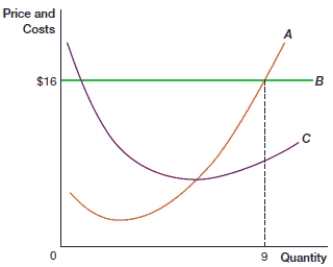
A) total cost
B) marginal cost
C) marginal revenue
D) average total cost
Correct Answer:
Verified
Q28: (Figure: Profit Maximization) In the figure,
Q29: (Figure: Profit Maximization) In the figure,
Q30: (Figure: Profit Maximization) In the figure,
Q31: The profit-maximizing level of output for all
Q32: (Figure: Maximum Profit in Perfect Competition) In
Q34: (Figure: Maximum Profit in Perfect Competition 0)
Q35: (Figure: Maximum Profit in Perfect Competition 0)
Q36: (Figure: Maximum Profit in Perfect Competition 0)
Q37: (Figure: Maximum Profit in Perfect Competition 0)
Q38: (Figure: Maximum Profit in Perfect Competition 3)
Unlock this Answer For Free Now!
View this answer and more for free by performing one of the following actions

Scan the QR code to install the App and get 2 free unlocks

Unlock quizzes for free by uploading documents