(Figure: Costs) In the figure, which of the following levels of output has the lowest AFC?
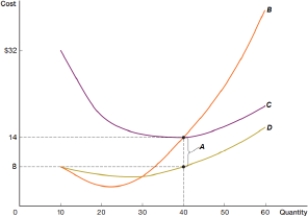
A) 30
B) 40
C) 50
D) 60
Correct Answer:
Verified
Q76: (Figure: Costs) In the figure, which represents
Q77: (Figure: Costs) In the figure, what is
Q78: (Figure: Costs) In the figure, what is
Q79: (Figure: Costs) In the figure, what are
Q80: (Figure: Costs) In the figure, what is
Q82: (Figure: Costs) In the figure, what level
Q83: (Figure: Costs) In the figure, what level
Q84: _ is responsible for the upward slope
Q85: The _ cost curve is U-shaped.
A) total
Q86: Because of increasing marginal costs, the _
Unlock this Answer For Free Now!
View this answer and more for free by performing one of the following actions

Scan the QR code to install the App and get 2 free unlocks

Unlock quizzes for free by uploading documents