(Figure: Externalities and Social Equilibrium 2) In this figure, which point represents the equilibrium that is likely to occur absent government intervention?
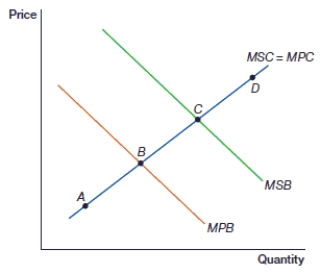
A) A
B) B
C) C
D) D
Correct Answer:
Verified
Q25: (Figure: Externalities 0) In this figure, which
Q26: (Figure: Externalities 0) In this figure, which
Q27: (Figure: Externalities 0) In this figure, which
Q28: (Figure: Externalities and Social Equilibrium 2) In
Q29: (Figure: Externalities and Social Equilibrium 2) In
Q31: (Figure: Externalities A) In this figure, the
Q32: (Figure: Externalities A) In this figure, which
Q33: (Figure: Externalities I) In this figure, the
Q34: (Figure: Externalities I) In this figure, which
Q35: Firm XYZ produces paper products, which sells
Unlock this Answer For Free Now!
View this answer and more for free by performing one of the following actions

Scan the QR code to install the App and get 2 free unlocks

Unlock quizzes for free by uploading documents