(Figure: Changing Tax Rates 0) In the figure, suppose that the tax rate is changed so that the market moves from the graph on the left to the graph on the right. This change would:
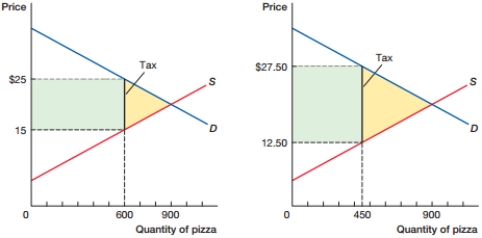
A) decrease tax revenue and decrease deadweight loss.
B) decrease tax revenue and increase deadweight loss.
C) increase tax revenue and decrease deadweight loss.
D) increase tax revenue and increase deadweight loss.
Correct Answer:
Verified
Q45: (Figure: Economic Impact of Taxation) In the
Q46: (Figure: Economic Impact of Taxation) 
Q47: (Figure: Economic Impact of Taxation) In the
Q48: The goal of a sales tax is
Q49: (Figure: Changing Tax Rates) The figure shows
Q51: (Figure: Changing Tax Rates A) In the
Q52: (Figure: Changing Tax Rates I) In the
Q53: (Figure: Changing Tax Rates Alpha) In the
Q54: In general, the burden of a tax
Q55: In general, the burden of a tax
Unlock this Answer For Free Now!
View this answer and more for free by performing one of the following actions

Scan the QR code to install the App and get 2 free unlocks

Unlock quizzes for free by uploading documents