Use the BMI-for-age chart as a reference for questions.
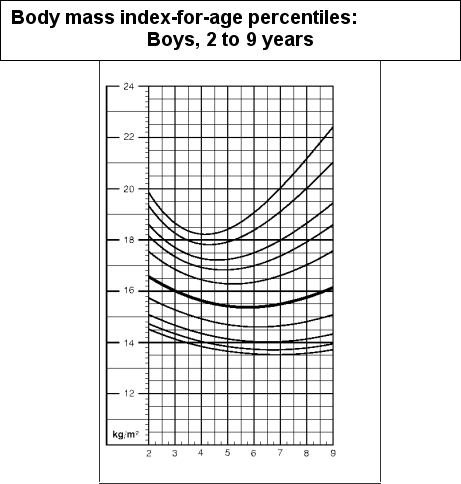
SOURCE: Entire chart developed by the National Center for Health Statistics in collaboration with the National Center for Chronic Disease Prevention and Health Promotion (2000) .Only the age range from 2 to 9 years was excerpted for exam.
-Plot the BMI you calculated from the previous question on the CDC growth chart above.What is the classification for this child's weight status?
A) Underweight
B) Normal weight
C) Overweight
D) Obese
Correct Answer:
Verified
Q1: Based on food consumption data from the
Q2: If weight loss was needed,what would you
Q4: Equations for estimating energy requirements are based
Q5: Which of the following would NOT be
Q6: Studies show that children of parents who
Q7: What would be the next recommended course
Q8: In 2009,approximately _ U.S.children did not have
Q9: Use the BMI-for-age chart as a reference
Q10: Adequate nutrition,especially eating breakfast,has been associated with:
A)improved
Q11: Which of the following would NOT be
Unlock this Answer For Free Now!
View this answer and more for free by performing one of the following actions

Scan the QR code to install the App and get 2 free unlocks

Unlock quizzes for free by uploading documents