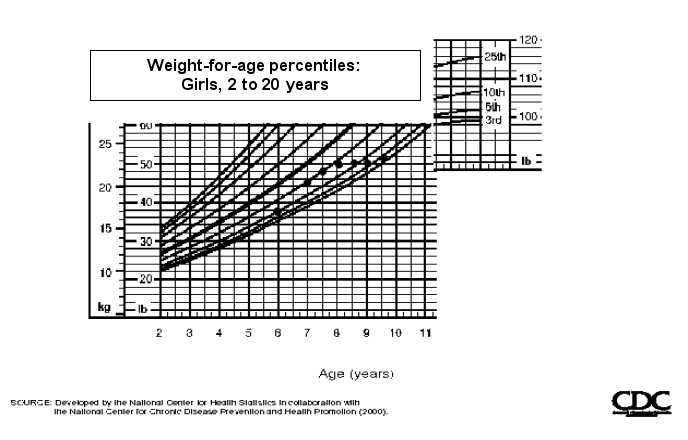
For question,please use the growth chart above,which depicts the weight-for-age percentiles for Rebecca.
-The black circles plotted on the CDC growth chart above report weight changes for Rebecca,a 9  -year-old female with cerebral palsy.She had multiple bronchitis/pneumonia episodes during the past 1
  years.What information can be interpreted from the growth chart?
A) She was unable to increase energy intake to compensate for the increases in expenditure caused by her illnesses.
B) She grew taller instead of gaining weight.
C) Her appetite was decreased throughout her illnesses.
D) Her cerebral palsy is getting worse.
Correct Answer:
Verified
Q13: Protein needs for children with special health
Q14: The incidence of cystic fibrosis is highest
Q15: Many families experience difficulties when their child
Q16: Children with _ would always be interpreted
Q17: Children with chronic conditions may have more
Q19: Factors that determine energy needs in children
Q20: What percentage of children with developmental delays
Q21: All of the following foods are found
Q22: _ has been shown to be effective
Q23: The mother of a child with cerebral
Unlock this Answer For Free Now!
View this answer and more for free by performing one of the following actions

Scan the QR code to install the App and get 2 free unlocks

Unlock quizzes for free by uploading documents