The accompanying figure details the possible outcomes in a scenario in which 10 zygotes are formed from a gene pool where the frequency of the allele A1 is 0.6,and A2 is 0.4.This graph is shown here.According to this graph,the probability that the frequency of A1 will increase to 0.7 in the next generation is about ________. 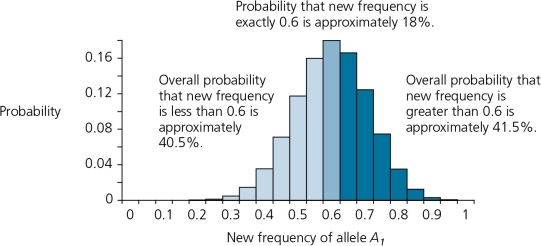
A) 8%.
B) 12%
C) 16%
D) 40%
E) 70%
Correct Answer:
Verified
Q1: If genetic drift is not accompanied by
Q2: The accompanying figure details the possible outcomes
Q4: Gene flow through migration _.
A) has no
Q5: The assumptions of the Hardy-Weinberg equilibrium principle
Q6: The results of an experiment on genetic
Q7: Unusually high rates of rare heritable traits,such
Q8: Data in the accompanying figure shows the
Q9: In an evolutionary sense,_ is the transfer
Q10: The random discrepancy between theoretical predictions and
Q11: There are occasions when theoretical expectations do
Unlock this Answer For Free Now!
View this answer and more for free by performing one of the following actions

Scan the QR code to install the App and get 2 free unlocks

Unlock quizzes for free by uploading documents