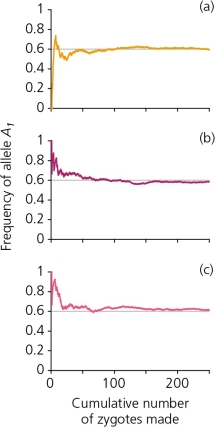
A scenario in which 250 zygotes are formed from a gene pool in which the frequency of the allele A₁ is 0.6,and A₂ is 0.4,generates the accompanying figure.Explain,in general terms,what each of these graphs reveals.Is there a consistent pattern between all three graphs? If so,describe and provide an explanation for it.Are there inconsistencies among graphs? Describe and provide an explanation for these also.
Correct Answer:
Verified
Q20: Figure 7.6 from your text,shown below,is a
Q21: A phenomenon known as _ [two words]
Q22: A phenomenon known as _ [one or
Q23: A locus at which different individuals in
Q24: Compare and contrast natural selection with genetic
Q25: The survival and fertility rates of the
Q26: The most common form of nonrandom mating
Q27: When we track alleles from lineages backwards
Q29: _,the most common type of nonrandom mating,will
Q30: Suppose a large population exists on a
Unlock this Answer For Free Now!
View this answer and more for free by performing one of the following actions

Scan the QR code to install the App and get 2 free unlocks

Unlock quizzes for free by uploading documents