The mean and standard error bars for four data sets are shown in the figure. Which of the data sets most likely has a variance of 144 and a sample size of 4?
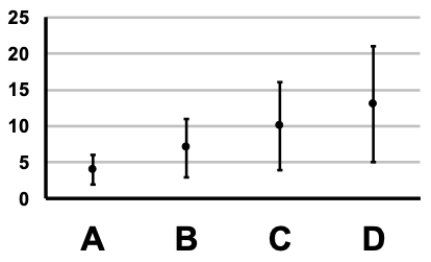
A) Plot A
B) Plot B
C) Plot C
D) Plot D
Correct Answer:
Verified
Q15: If a sample of size of 20
Q16: If a sample of size of 30
Q17: The mean and standard error bars for
Q18: The mean and standard error bars for
Q19: The mean and standard error bars for
Q21: The mean and 95% confidence interval bars
Q22: The mean and 95% confidence interval bars
Q23: The mean and 95% confidence interval bars
Q24: The mean and 95% confidence interval bars
Q25: The symbol Ȳ represents the population mean.
Unlock this Answer For Free Now!
View this answer and more for free by performing one of the following actions

Scan the QR code to install the App and get 2 free unlocks

Unlock quizzes for free by uploading documents