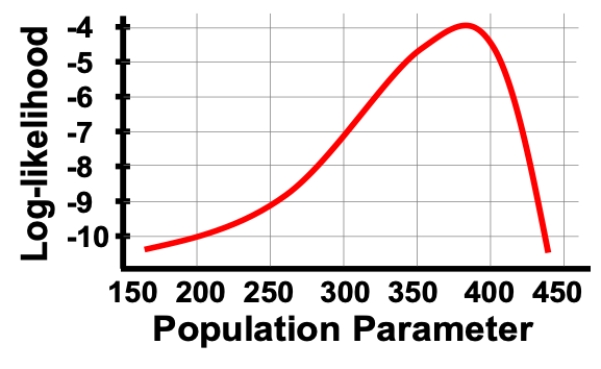
Consider a situation in which we plot the log-likelihood values for a range of parameter values as shown in the figure. What is the MLE and 95% confidence interval of the MLE based on this figure?
Correct Answer:
Verified
Q23: A good rule of thumb for the
Q24: The maximum likelihood approach is very powerful
Q25: Larger sample sizes reduce the bias often
Q26: The bias in maximum likelihood estimation is
Q27: If the null hypothesis is true, then
Q28: When doing a log-likelihood ratio test, the
Q29: In your own words describe what likelihood
Q30: Consider a situation in which we plot
Q32: Describe how and why we can use
Q33: Describe the logic of the log-likelihood ratio
Unlock this Answer For Free Now!
View this answer and more for free by performing one of the following actions

Scan the QR code to install the App and get 2 free unlocks

Unlock quizzes for free by uploading documents