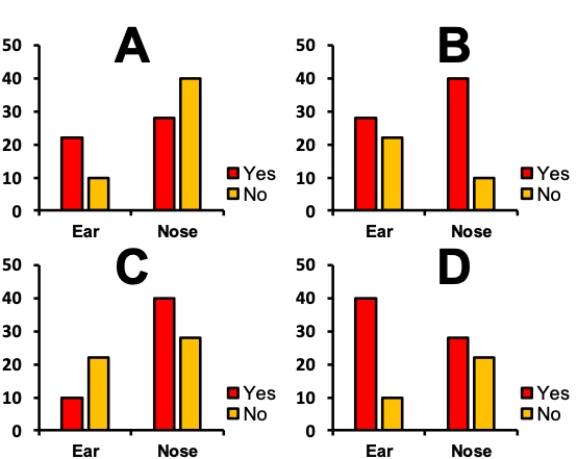
Consider a situation in which bacterial swabs were taken from the ears and noses of 50 study subjects, and the number of swabs that showed the presence of staphylococcus were measured. The table shows the results of the measurements. Which of the grouped bar graphs shown correctly depicts this data?
?
Contingency table showing presence of Staphylococcus in swabs from different body parts.
? ?
?
A) Plot A
B) Plot B
C) Plot C
D) Plot D
Correct Answer:
Verified
Q24: Consider the histograms of a data set
Q25: Consider the histogram shown. What two words
Q26: Consider the histogram shown. What two words
Q27: What of the following is the best
Q28: Consider a situation in which bacterial
Q30: Consider a situation in which tumor-prone
Q31: Consider a situation in which bacterial
Q32: Mosaic plots and grouped bar graphs display
Q33: Consider an experiment in which rats are
Q34: Consider an experiment in which rats are
Unlock this Answer For Free Now!
View this answer and more for free by performing one of the following actions

Scan the QR code to install the App and get 2 free unlocks

Unlock quizzes for free by uploading documents