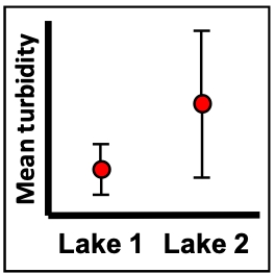
Imagine a series of turbidity (cloudiness) measurements in the water from two different lakes. The measurements were taken over many different days (30 samples for each lake) and the figure shows the mean turbidity of those measurements along with bars representing 95% confidence intervals. What can we conclude about the appropriate null hypothesis and mean turbidity of the two lakes?
A) Fail to reject the null hypothesis, we lack evidence that the turbidity differs between the lakes.
B) Reject the null hypothesis, we have evidence that the turbidity differs between the lakes.
C) Reject the null hypothesis, we lack evidence that the turbidity differs between the lakes.
D) We can't really tell from this figure whether the null hypothesis will be rejected or not.
Correct Answer:
Verified
Q25: Consider an urban ecologist who is interested
Q26: Consider urban ecologists who are interested in
Q27: Consider urban ecologists who are interested in
Q28: Consider urban ecologists who are interested in
Q29: When we have two data sets that
Q31: Imagine a series of turbidity (cloudiness) measurements
Q32: Imagine a series of turbidity (cloudiness) measurements
Q33: The F-test for comparing variances has a
Q34: Which of the following is not an
Q35: In a paired design, both treatments are
Unlock this Answer For Free Now!
View this answer and more for free by performing one of the following actions

Scan the QR code to install the App and get 2 free unlocks

Unlock quizzes for free by uploading documents