Consider the figure showing the final position of balls dropped that had been aimed at the indentation. Which of the plots shows the situation best described as poor accuracy, poor precision?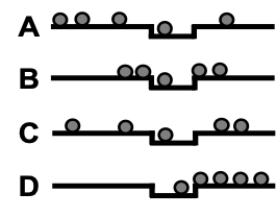
A) Plot A
B) Plot B
C) Plot C
D) Plot D
Correct Answer:
Verified
Q8: Ideal samples are unbiased; which of the
Q9: Sampling error is defined as differences between
Q10: Consider the figure showing the final position
Q11: Consider the figure showing the final position
Q12: Consider the figure showing the final position
Q14: Imagine there is a forest with 2000
Q15: When a researcher takes a sample of
Q16: When a study recruits people at large
Q17: Characteristics or measurements that differ from individual
Q18: The measurements of one or more variables
Unlock this Answer For Free Now!
View this answer and more for free by performing one of the following actions

Scan the QR code to install the App and get 2 free unlocks

Unlock quizzes for free by uploading documents