(Figure: Determining Consumer and Producer Surplus) Based on the graph, area _____ represents producer surplus.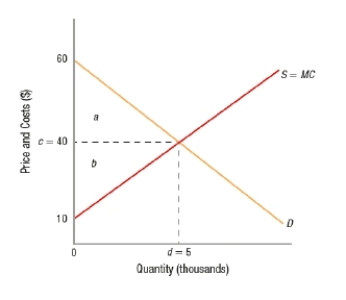
A) a
B) b
C) c
D) d
Correct Answer:
Verified
Q46: The area under the demand curve but
Q47: When positive externalities are present, the social
Q48: Which of these is an example of
Q49: _ are examples of market failure caused
Q50: (Figure: Determining Consumer and Producer Surplus) Based
Q52: (Figure: Determining Consumer and Producer Surplus) Based
Q53: (Figure: Determining Consumer and Producer Surplus) Based
Q54: Which of these is a positive externality?
A)
Q55: If a metal stamping plant produces negative
Q56: If an entrepreneur opens an adult day
Unlock this Answer For Free Now!
View this answer and more for free by performing one of the following actions

Scan the QR code to install the App and get 2 free unlocks

Unlock quizzes for free by uploading documents