(Figure: Toxic Waste) From the graph, the socially optimal outcome would lead to total surplus (consumer plus producer) of _____ and external costs of _____, so the optimal amount of toxic waste produced should be _____ tons.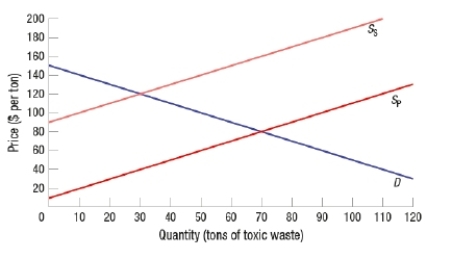
A) $2,450; $2,400; 30
B) $2,700; $1,200; 70
C) $4,900; $1,200; 50
D) $900; $2,400; 0
Correct Answer:
Verified
Q59: Market failure occurs when
A) quantity supplied does
Q60: (Table: Property Values) A local university
Q61: (Figure: Toxic Waste) From the graph, the
Q62: (Figure: Toxic Waste) From the graph, the
Q63: (Figure: Toxic Waste) From the graph, external
Q65: _ is when once a good or
Q66: All of these are considered private goods
Q67: A physical DVD disc is a(n) _
Q68: An over-the-air radio station that plays music
Q69: A news website that can be accessed
Unlock this Answer For Free Now!
View this answer and more for free by performing one of the following actions

Scan the QR code to install the App and get 2 free unlocks

Unlock quizzes for free by uploading documents