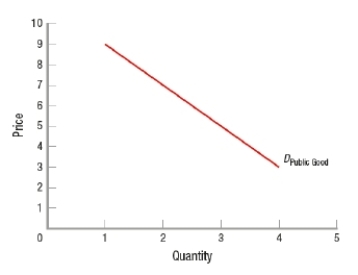
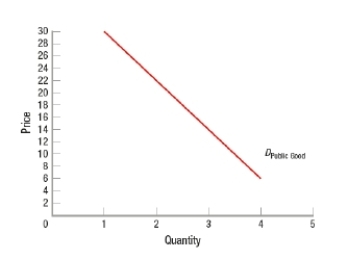
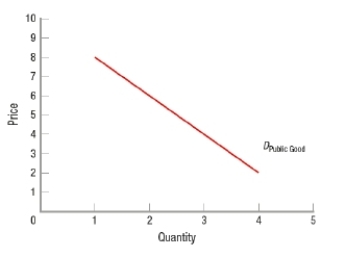
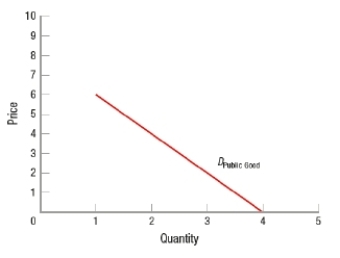
(Table) In the table, P1 through P4 are the prices that four consumers are willing to pay for different quantities of a public good. Which graph would represent the total willingness-to-pay for the public good?
A)
B)
C)
D)
Correct Answer:
Verified
Q98: Which event would be an example of
Q99: Highway congestion is an example of the
Q100: The Barbary macaque is an example of
A)
Q101: If a producer can have access to
Q102: Government restrictions on common property resources
A) can
Q104: Which of these is/are TRUE?
I. The tragedy
Q105: (Table: Public Goods) The table shows
Q106: (Table: Public Goods) The table shows
Q107: (Table: Public Goods) The table shows
Q108: If a plant that employs 1,500 workers
Unlock this Answer For Free Now!
View this answer and more for free by performing one of the following actions

Scan the QR code to install the App and get 2 free unlocks

Unlock quizzes for free by uploading documents