This graph is for a firm that pollutes as a result of its manufacturing processes.
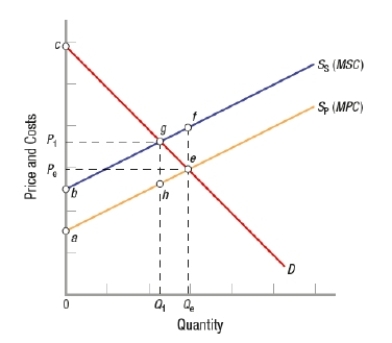 Supply curve SP represents the manufacturer's supply curve when only its private costs are considered. If pollution costs equal to ef are generated for every unit produced, the true marginal cost to society, including pollution costs, of producing the product is equal to supply curve SS. Explain why Q1 is better for society than Qe. Include information regarding consumer/producer surplus in your response.
Correct Answer:
Verified
View Answer
Unlock this answer now
Get Access to more Verified Answers free of charge
Q274: One criticism regarding actions to combat climate
Q275: Elinor Ostrom's work has shown that the
Q276: What are negative and positive externalities? Provide
Q277: Describe how both consumers and producers can
Q278: The table shows data on the
Q280: Explain the Coase theorem with reference to
Q281: Why is it not always possible for
Q282: A city in which residents value
Q283: A farmer puts pesticides on his
Q284: What does it mean when a market
Unlock this Answer For Free Now!
View this answer and more for free by performing one of the following actions

Scan the QR code to install the App and get 2 free unlocks

Unlock quizzes for free by uploading documents