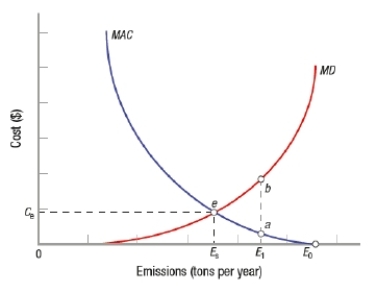
Explain why the socially optimal level of pollution in the following graph is ES, at a cost to society of Ce (point e).
Correct Answer:
Verified
View Answer
Unlock this answer now
Get Access to more Verified Answers free of charge
Q290: What is the pricing formula that yields
Q291: How does the presence of each of
Q292: What are some of the reasons for
Q293: Describe the role of a consideration of
Q294: Explain how marginal analysis is used to
Q296: Why are command and control environmental policies
Q297: Explain how a tradable permit system works.
Q298: Describe two of the most frequently used
Q299: Why might marketable permits be considered a
Q300: Briefly describe the differences between the market-based
Unlock this Answer For Free Now!
View this answer and more for free by performing one of the following actions

Scan the QR code to install the App and get 2 free unlocks

Unlock quizzes for free by uploading documents