(Figure: Labor Supply Curve) Based on the graph, we see that this person is willing to supply _____ hours of labor at wage rate W1 than at W2 and _____ hours of labor at wage rate W3 than at W2.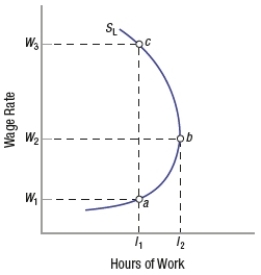
A) more; more
B) more; fewer
C) fewer; fewer
D) fewer; more
Correct Answer:
Verified
Q15: As wages rise, if an employee works
Q16: The substitution effect for labor supply states
Q17: The income effect for labor supply states
Q18: An individual's supply of labor is _
Q19: Theoretically, how would an individual working at
Q21: (Figure: Labor Supply Curve) The figure below
Q22: (Figure: Labor Supply Curve) Based on the
Q23: (Figure: Labor Supply Curve) Based on the
Q24: When people choose leisure over work as
Q25: You are willing to work 30 hours
Unlock this Answer For Free Now!
View this answer and more for free by performing one of the following actions

Scan the QR code to install the App and get 2 free unlocks

Unlock quizzes for free by uploading documents