(Figure: Monopolists in Monopsony Markets) The graph depicts a firm that is a monopolist in the product market but a monopsony in the input market. Which curve represents the marginal revenue product of labor?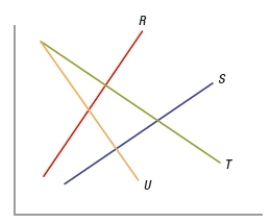
A) R
B) S
C) T
D) U
Correct Answer:
Verified
Q223: Compared with a competitive labor market, a
Q224: If nineteen workers are each paid $10
Q225: If ten workers are each paid $9
Q226: (Figure: Understanding Monopsony Markets) The graph represents
Q227: (Figure: Understanding Monopsony Markets) The graph represents
Q229: (Figure: Monopolists in Monopsony Markets) The graph
Q230: In the town of Econ City, a
Q231: Because P > MR, which equation applies
Q232: Karl Marx wrote
A) Principles of Economics.
B) The
Q233: Which economist stated, "The only solution to
Unlock this Answer For Free Now!
View this answer and more for free by performing one of the following actions

Scan the QR code to install the App and get 2 free unlocks

Unlock quizzes for free by uploading documents