(Figure: Bowling and Chinese Buffet) Bill can consume ten Chinese buffets or go bowling five times per month (or any other specific other combinations) . This graph represents Bill's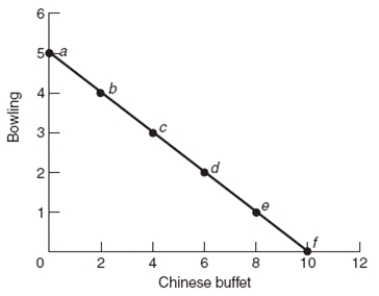
A) utility curve.
B) demand curve.
C) indifference curve.
D) budget line.
Correct Answer:
Verified
Q9: Tena has $50 per week to spend
Q10: Suppose the price of a hamburger is
Q11: Assume that you have $60 a week
Q12: Suppose you have $100 to spend on
Q13: Suppose you have $100 to spend on
Q15: (Figure: Bowling and Chinese Buffet) The price
Q16: (Figure: Bowling and Chinese Buffet) The price
Q17: (Figure: Bowling and Chinese Buffet) If the
Q18: (Figure: Bowling and Chinese Buffet) If the
Q19: (Figure: Movie Tickets and Gasoline) How many
Unlock this Answer For Free Now!
View this answer and more for free by performing one of the following actions

Scan the QR code to install the App and get 2 free unlocks

Unlock quizzes for free by uploading documents