(Figure: Interpreting Price Changes) Based on the graph, if the price for shoes increases from $40 to $80 (from point d to point b) , the net revenue lost, or gained, would be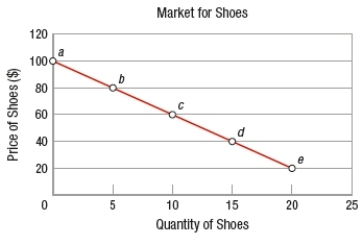
A) $0 net loss/gain.
B) $200 net gain.
C) $200 net loss.
D) $400 net gain.
Correct Answer:
Verified
Q113: If a store sells a good that
Q114: If a store sells a good that
Q115: If a store sells a good with
Q116: If the price elasticity of demand for
Q117: (Figure: Interpreting Price Changes) Based on the
Q119: Increasing prices _ total revenue for a
Q120: Increasing prices has no effect on total
Q121: When consumers are loyal to a particular
Q122: Assume the demand for coffee is inelastic.
Q123: Assume the demand for a good is
Unlock this Answer For Free Now!
View this answer and more for free by performing one of the following actions

Scan the QR code to install the App and get 2 free unlocks

Unlock quizzes for free by uploading documents