(Figure) The figure shows two supply curves for two different periods for the same product. If the price of the product increased from $20 to $25, the price elasticity of supply will be _____ in the short run and _____ in the long run using the midpoint method.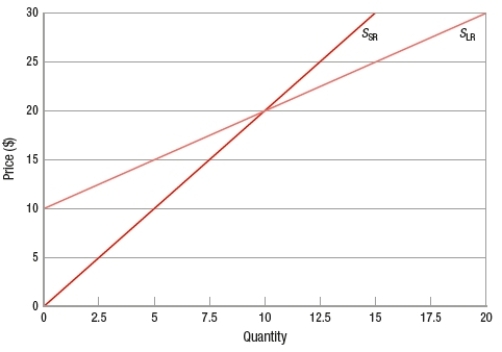
A) 1; 1.8
B) 0.56; 1
C) 1.8; 1.5
D) 1; 1.67
Correct Answer:
Verified
Q208: In which period can firms decide to
Q209: Which event is a long-run adjustment for
Q210: Which event describes a short-run adjustment for
Q211: The MAIN determinant of price elasticity of
Q212: The _ is so short that the
Q214: The long-run supply curve can have a
Q215: In the long run
A) the supply curve
Q216: If a producer lowers its price from
Q217: (Figure) The figure shows two supply curves
Q218: A tax in which the percentage of
Unlock this Answer For Free Now!
View this answer and more for free by performing one of the following actions

Scan the QR code to install the App and get 2 free unlocks

Unlock quizzes for free by uploading documents