(Figure) The graph depicts a market with a supply tax. Using the equilibrium prices and quantities before and after the tax, the price elasticity of demand is _____. Use the midpoint method to calculate your answers.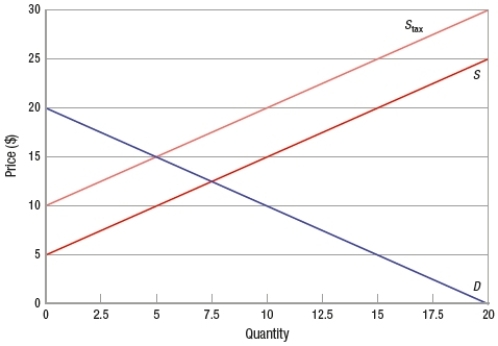
A) 0.45
B) 1.8
C) 2.2
D) 1.01
Correct Answer:
Verified
Q267: (Figure: Effects of Excise Tax) Based on
Q268: (Figure: Effects of Excise Tax) Based on
Q269: (Figure: Effects of Excise Tax) Based on
Q270: (Figure: Effects of Excise Tax) Based on
Q271: For a given supply curve, the more
Q273: (Figure) The figure shows a market with
Q274: The current equilibrium price in the market
Q275: Elasticity is a measure of the responsiveness
Q276: The concept of elasticity is limited to
Q277: Economists use the absolute value of the
Unlock this Answer For Free Now!
View this answer and more for free by performing one of the following actions

Scan the QR code to install the App and get 2 free unlocks

Unlock quizzes for free by uploading documents