(Figure) The figure shows a market with a supply tax with quantity measured in thousands. The dead weight loss due to the tax is _____ and the tax incidence is _____.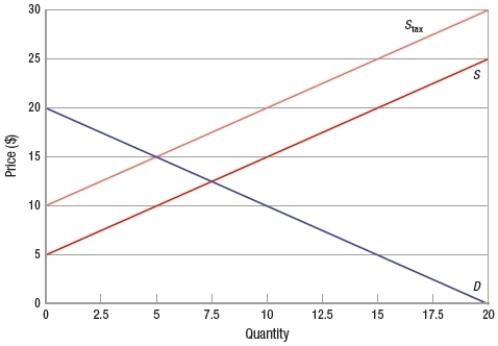
A) $6,250; borne evenly
B) $12,500; borne more heavily by producers
C) $3,125; borne more heavily by consumers
D) $18,750; zero
Correct Answer:
Verified
Q268: (Figure: Effects of Excise Tax) Based on
Q269: (Figure: Effects of Excise Tax) Based on
Q270: (Figure: Effects of Excise Tax) Based on
Q271: For a given supply curve, the more
Q272: (Figure) The graph depicts a market with
Q274: The current equilibrium price in the market
Q275: Elasticity is a measure of the responsiveness
Q276: The concept of elasticity is limited to
Q277: Economists use the absolute value of the
Q278: The elasticity value of a perfectly elastic
Unlock this Answer For Free Now!
View this answer and more for free by performing one of the following actions

Scan the QR code to install the App and get 2 free unlocks

Unlock quizzes for free by uploading documents