In the following graph, if the price of a good increases from $4 to $6, the amount of deadweight loss in this market would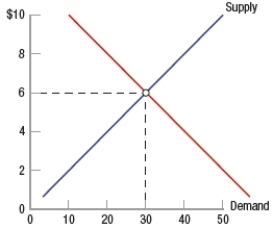
A) fall to $0.
B) increase by $2.
C) remain unchanged.
D) increase to $30.
Correct Answer:
Verified
Q9: In the following graph, calculate the value
Q10: Total surplus is maximized when the price
Q11: One reason that deadweight loss occurs is
Q12: In which situation would deadweight loss be
Q13: When the price of Frisbees used in
Q15: The equilibrium price of cocoa beans is
Q16: When states pass laws to raise the
Q17: Which scenario is likely to occur when
Q18: In the following graph, if a price
Q19: In the following graph, if the price
Unlock this Answer For Free Now!
View this answer and more for free by performing one of the following actions

Scan the QR code to install the App and get 2 free unlocks

Unlock quizzes for free by uploading documents