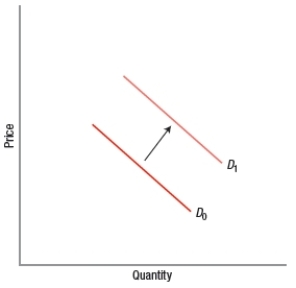
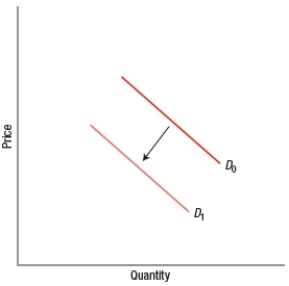
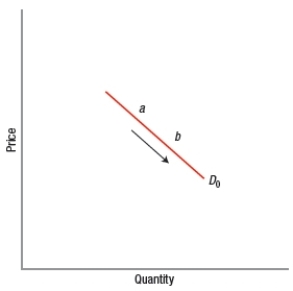
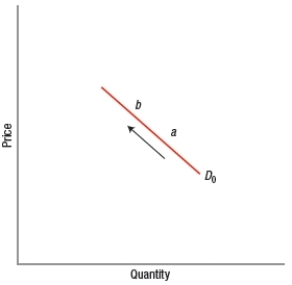
Which graph concerning electric vehicles indicates an increase in the quantity demanded of electric vehicles?
A)
B)
C)
D)
Correct Answer:
Verified
Q1: The equation for the demand curve for
Q2: (Table) The table shows the demand
Q4: Which graph shows an increase in quantity
Q5: (Figure: Interpreting Market Equilibrium) If the price
Q6: (Figure: Interpreting Market Equilibrium) If the price
Q7: Suppose
Q8: Is the unauthorized sale of restricted narcotics
Q9: Which market is most likely to sell
Q10: Which is not a typical way in
Q11: Which is not a purpose that prices
Unlock this Answer For Free Now!
View this answer and more for free by performing one of the following actions

Scan the QR code to install the App and get 2 free unlocks

Unlock quizzes for free by uploading documents