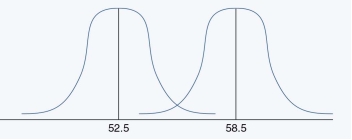
We hypothesized that our sample mean of 58.5 is larger than the population mean of 52.5. This is can be graphed in the following manner.
Correct Answer:
Verified
Q14: For a sample size of 30, we
Q15: A researcher calculates a mean from
Q16: When a researcher selects a particular alpha
Q17: The z- and t-distributions have nearly identical
Q18: Because proportions are not whole numbers, the
Q19: Because the t- and z-distributions use different
Q20: The critical value of t at a
Q21: The following equation,
Q23: Discuss the five steps in hypothesis testing.
Q24: Using distributions for visual depiction, draw out
Unlock this Answer For Free Now!
View this answer and more for free by performing one of the following actions

Scan the QR code to install the App and get 2 free unlocks

Unlock quizzes for free by uploading documents