Refer to the figure.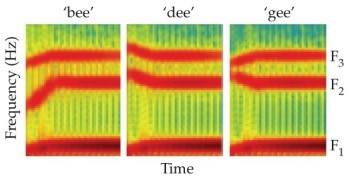 This figure shows _______ of sounds.
A) graphs
B) frequencies
C) articulations
D) spectrograms
E) vocalization plots
Correct Answer:
Verified
Q26: The three basic components of the production
Q27: _ is the act or manner of
Q28: Each consonant we produce can be classified
Q29: Refer to the graph. Q30: A(n) _ is a pattern for sound Q32: The phenomenon in speech whereby attributes of Q33: Understanding human speech is a challenge for Q34: In categorical perception, listeners Q35: The theory stating that the processes used Q36: _ is the phenomenon whereby a person![]()
A) discriminate sounds that
Unlock this Answer For Free Now!
View this answer and more for free by performing one of the following actions

Scan the QR code to install the App and get 2 free unlocks

Unlock quizzes for free by uploading documents