Refer to the graph.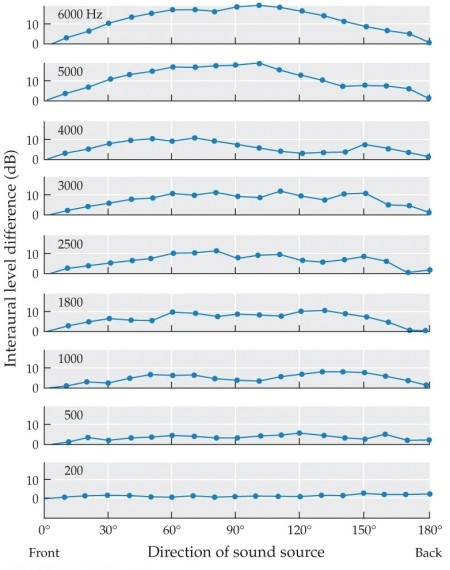 This graph shows _______ for tones of different frequencies presented at different positions around the head.
A) interaural level differences
B) cones of confusion
C) pitch differences
D) loudness differences
E) interaural time differences
Correct Answer:
Verified
Q2: The azimuth is the
A) distance between the
Q3: Suppose you are in the woods and
Q4: Refer to the figure. Q5: Which method(s) of sound localization between the Q6: Which method(s) of sound localization between the Q8: Which direction on the azimuth would have Q9: _ refers to the region of positions Q10: Which of the following do(es) not contribute Q11: Refer to the figure. Q12: The _ is a function that describes![]()
![]()
Unlock this Answer For Free Now!
View this answer and more for free by performing one of the following actions

Scan the QR code to install the App and get 2 free unlocks

Unlock quizzes for free by uploading documents