Refer to the graph.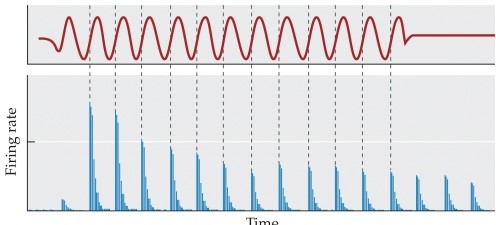 This graph illustrates the phenomenon of
A) rate saturation.
B) phase locking.
C) spontaneous firing.
D) threshold tuning.
E) characteristic frequency.
Correct Answer:
Verified
Q41: Refer to the graph. Q42: Rate saturation occurs when a nerve fiber Q43: Refer to the graph. Q44: Which of these choices refers to a Q45: The _ refers to a graph that Q47: Refer to the graph. Q48: Some auditory nerves fire in synchrony at Q49: _ refers to the idea that multiple Q50: Refer to the figure. Q51: All auditory nerve fibers initially synapse in Unlock this Answer For Free Now! View this answer and more for free by performing one of the following actions Scan the QR code to install the App and get 2 free unlocks Unlock quizzes for free by uploading documents![]()
![]()
![]()
![]()

