Multiple Choice
Refer to the graph.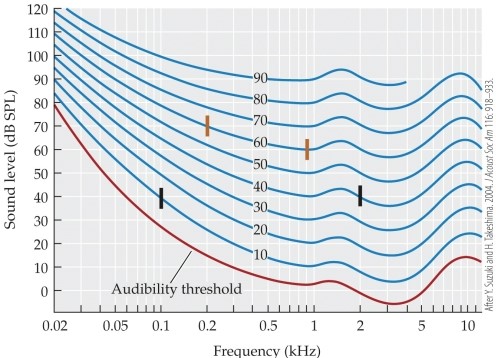 What is being plotted in this graph?
A) Auditory response curves
B) Equal frequency curves
C) Psychoacoustic threshold curves
D) Equal sound-level curves
E) Equal-loudness curves
Correct Answer:
Verified
Related Questions
Q53: The primary auditory cortex (A1) is organized
Q54: The first area within the temporal lobes
Q55: The belt area has neurons that respond
Q56: _ is the study of the psychological
Q57: If you are building a pair of
Unlock this Answer For Free Now!
View this answer and more for free by performing one of the following actions

Scan the QR code to install the App and get 2 free unlocks

Unlock quizzes for free by uploading documents