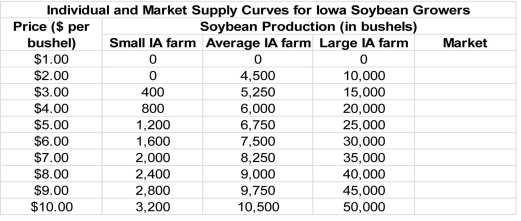
-Refer to the table above.Which producer exhibits the greatest increase in quantity supplied for a $1.00 per bushel increase in the price of soybeans?
A) The small Iowa farm
B) The average Iowa farm
C) The large Iowa farm
D) Both the average and large Iowa farms
Correct Answer:
Verified
Q89: The figure below shows the supply curves
Q90: All else being equal,an increase in the
Q91: Which of the following is the best
Q92: The figure below shows the supply curves
Q93: The figure below shows the supply curves
Q95: The following table shows the supply schedule
Q96: The figure below shows the supply curves
Q97: The figure below shows the supply curves
Q98: The market supply is the _ of
Q99: Based on the derived market quantity supplied,what
Unlock this Answer For Free Now!
View this answer and more for free by performing one of the following actions

Scan the QR code to install the App and get 2 free unlocks

Unlock quizzes for free by uploading documents