The table below provides data on opium sales and farmgate prices of opium in Afghanistan from 1994 to 2008.
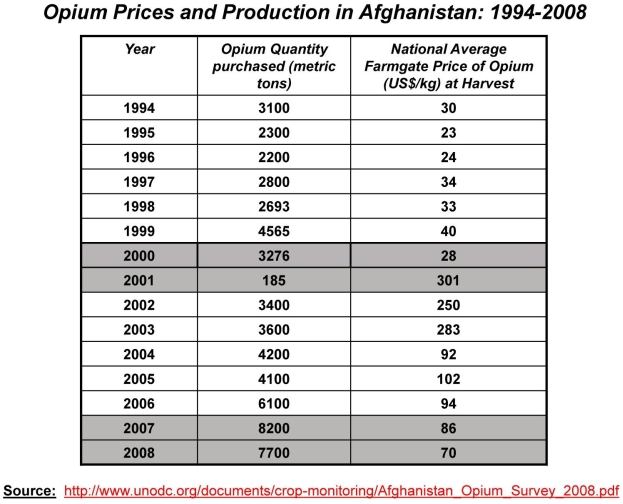
-Refer to the table above.From 2000 to 2001,opium sales fell by 95 percent and opium prices increased by 975 percent.If you are told that demand curve for opium in Afghanistan remained constant from 2000 to 2001,what was the likely change in opium supply?
A) Increase in only quantity supplied
B) Decrease in only quantity supplied
C) Increase in supply
D) Decrease in supply
Correct Answer:
Verified
Q168: If the current market price of wheat
Q169: Scenario: Suppose the market for wheat in
Q170: Scenario: Suppose that the government imposes a
Q171: The figure below shows the market demand
Q172: Using graphs,explain how the equilibrium price and
Q174: Scenario: Suppose that the government imposes a
Q175: Assume that the supply curve for a
Q176: Which of the following was an effect
Q177: Assume that the supply curve for a
Q178: Assume that the supply curve for a
Unlock this Answer For Free Now!
View this answer and more for free by performing one of the following actions

Scan the QR code to install the App and get 2 free unlocks

Unlock quizzes for free by uploading documents