The following table shows the GDP per capita of country X for 3 years.
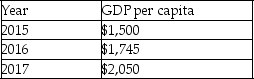
-Refer to the table above.At what rate did the country grow between 2016 and 2017?
A) 13.63 percent
B) 15.55 percent
C) 17.47 percent
D) 19.24 percent
Correct Answer:
Verified
Q10: The following table shows the GDP per
Q11: Suppose GDP per capita is $2,500 in
Q12: Which of the following describes the effect
Q13: The following table shows the GDP per
Q14: Which statement best describes the effect of
Q16: Which of the following characterized the U.S.economy
Q17: The advantage of using real GDP over
Q18: Real GDP refers to GDP adjusted for
Q19: The process by which a quantity grows
Q20: The _ nature of economic growth is
Unlock this Answer For Free Now!
View this answer and more for free by performing one of the following actions

Scan the QR code to install the App and get 2 free unlocks

Unlock quizzes for free by uploading documents