The following figure shows graphs of various types of growth.
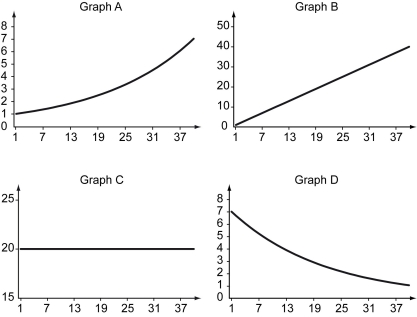
-Refer to the figure above.The data in Graph C best represent ________.
A) linear growth
B) no growth
C) exponential growth
D) exponential decline
Correct Answer:
Verified
Q22: Refer to the scenario above.What will be
Q23: Which of the following statements is true?
A)
Q24: GDP per capita in Australia is $50,000.If
Q25: The following figure shows graphs of various
Q26: Initially Country A has a greater GDP
Q28: Exponential growth implies that _.
A) growth rates
Q29: Refer to the scenario above.What will be
Q30: Refer to the scenario above.What will be
Q31: When current growth builds on past growth,growth
Q32: Refer to the scenario above.Which of the
Unlock this Answer For Free Now!
View this answer and more for free by performing one of the following actions

Scan the QR code to install the App and get 2 free unlocks

Unlock quizzes for free by uploading documents