The following table shows the GDP per capita of various countries for the years 1960 and 2010 in PPP-adjusted 2005 dollars.The table also contains the implied growth rates,which show how much on average each country needed to grow each year to reach the 2010 level of GDP per capita starting from the 1960 level of GDP per capita.Use the table to answer the following questions.
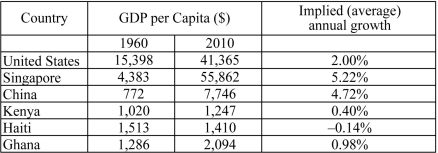
a)During 1960-2010,which countries were able to reduce the gap between their GDP per capita and the U.S.GDP per capita?
b)During 1960-2010,which countries failed to reduce the gap between their GDP per capita and the U.S.GDP per capita?
c)Why have some countries reduced the gap between their incomes and that of the United States and other countries failed to do so?
Correct Answer:
Verified
View Answer
Unlock this answer now
Get Access to more Verified Answers free of charge
Q41: The countries that have experienced fast growth
Q42: While countries like Botswana and Singapore have
Q43: "Catch-up growth" refers to a process where
Q44: Suppose that a nation's GDP per capita
Q45: Which of the following pairs of countries
Q47: The growth process whereby relatively poorer nations
Q48: Catch-up growth is characterized by disparities in
Q49: Country A's GDP per capita is 80
Q50: Scenario: In 2000, the GDP per capita
Q51: China's GDP per capita is currently lower
Unlock this Answer For Free Now!
View this answer and more for free by performing one of the following actions

Scan the QR code to install the App and get 2 free unlocks

Unlock quizzes for free by uploading documents