The following figure shows labor supply and demand curves.
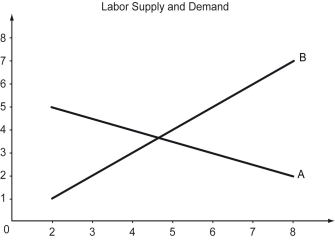
-Refer to the figure above.What is the appropriate label for the x-axis?
A) Labor demanded
B) Quantity of labor
C) Labor supplied
D) Wage rate
Correct Answer:
Verified
Q63: Scenario: Suppose that professors pay their teaching
Q64: The value of the marginal product of
Q65: If a firm hires a worker by
Q66: The following figure shows labor supply and
Q67: Scenario: Suppose that professors pay their teaching
Q69: Which of the following equations is true
Q70: The labor demand curve represents the relationship
Q71: The following figure shows labor supply and
Q72: How is the wage to be paid
Q73: What causes the labor demand curve to
Unlock this Answer For Free Now!
View this answer and more for free by performing one of the following actions

Scan the QR code to install the App and get 2 free unlocks

Unlock quizzes for free by uploading documents