The following figure shows wage versus labor demand.
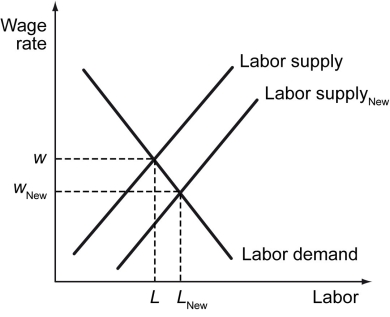
-Refer to the figure above.The shift from the labor supply curve to the new labor supply curve could be caused by ________.
A) an increase in the marginal productivity of labor
B) a decrease in the marginal productivity of labor
C) an increase in the opportunity cost of working
D) a decrease in the opportunity cost of working
Correct Answer:
Verified
Q111: Several people from a neighboring country migrated
Q112: The figure below shows labor supply and
Q113: The impact of an increase in the
Q114: The figure below shows labor supply and
Q115: As the wage rate increases,the _,assuming all
Q117: Any change that increases the quantity of
Q118: Which of the following is likely to
Q119: The following figure shows wage versus labor
Q120: Which of the following is likely to
Q127: The following figure shows two labor demand
Unlock this Answer For Free Now!
View this answer and more for free by performing one of the following actions

Scan the QR code to install the App and get 2 free unlocks

Unlock quizzes for free by uploading documents