The figure below shows labor supply and labor demand curves.
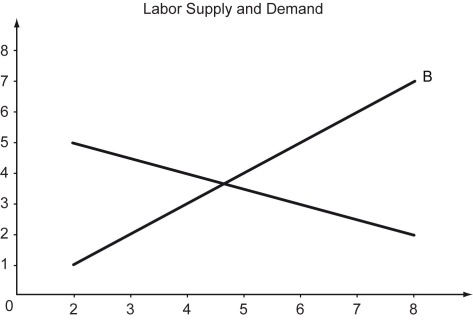
-Refer to the figure above.What is the equilibrium wage rate and quantity of labor?
A) Wage rate = 5; Quantity of labor = 6
B) Wage rate = 3.75; Quantity of labor = 4.5
C) Wage rate = 3.25; Quantity of labor = 4.25
D) Wage rate = 4.5; Quantity of labor = 3.5
Correct Answer:
Verified
Q120: Which of the following is likely to
Q122: Which of the following statements is true
Q123: The following figure shows two labor demand
Q124: Which of the following statements is true?
A)
Q126: Suppose the labor market for industrial workers
Q127: The following figure shows two labor demand
Q127: The following figure shows two labor demand
Q128: Which of the following statements is true?
A)
Q129: Which of the following statements is true?
A)
Q130: Which of the following statements is true?
A)
Unlock this Answer For Free Now!
View this answer and more for free by performing one of the following actions

Scan the QR code to install the App and get 2 free unlocks

Unlock quizzes for free by uploading documents