The following figure shows the labor demand curve, LD₁, and labor supply curve, LS₁, in a market.
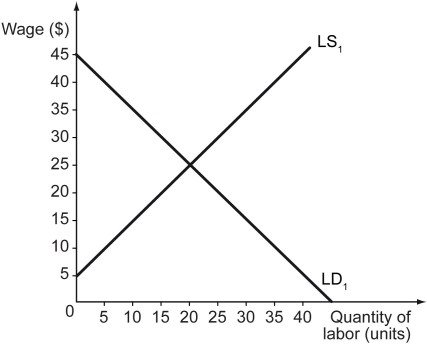
-Refer to the figure above.If the government fixes the minimum wage rate at $25,the unemployment in the market will be ________.
A) 0 units of labor
B) 10 units of labor
C) 20 units of labor
D) 30 units of labor
Correct Answer:
Verified
Q159: Scenario: Jim, Pam, Michael, and Angela all
Q160: Scenario: Jim, Pam, Michael, and Angela all
Q161: Which of the following statements is true?
A)
Q162: Which of the following statements is true
Q163: The following figure shows the labor demand
Q165: Minimum wage laws _.
A) are used to
Q166: Unemployment that arises when there is a
Q167: The following figure shows the labor demand
Q168: Scenario: Truck drivers across the country are
Q169: The following figure shows the labor demand
Unlock this Answer For Free Now!
View this answer and more for free by performing one of the following actions

Scan the QR code to install the App and get 2 free unlocks

Unlock quizzes for free by uploading documents