The figure below shows labor supply and labor demand curves.
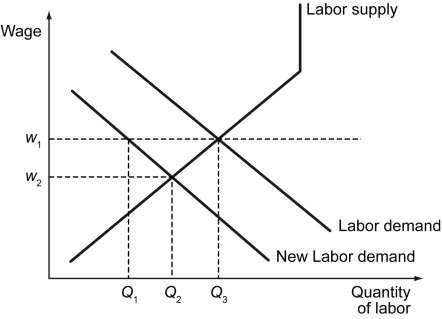
-Refer to the figure above.Assume that the market is at equilibrium at w₂ and Q₂.A minimum wage is imposed at w₁.How will this affect unemployment?
A) Unemployment will decrease to Q₃ − Q₂
B) Unemployment will increase to Q₃ − Q₁
C) Unemployment will decrease to Q₂ − Q₁
D) Unemployment will increase to Q₂ − Q₁
Correct Answer:
Verified
Q185: Which of the following statements is true?
A)
Q186: Collective bargaining between unions and employers often
Q187: _ increase workers' productivity and improve the
Q188: The figure below shows labor supply and
Q189: Scenario: Truck drivers across the country are
Q191: The figure below shows labor supply and
Q192: Contract negotiations between an employer and a
Q193: Scenario: Truck drivers across the country are
Q194: At a fixed level of worker productivity,_.
A)
Q195: Collective bargaining can _.
A) reduce wages
B) increase
Unlock this Answer For Free Now!
View this answer and more for free by performing one of the following actions

Scan the QR code to install the App and get 2 free unlocks

Unlock quizzes for free by uploading documents