The figure below shows labor supply and labor demand curves.
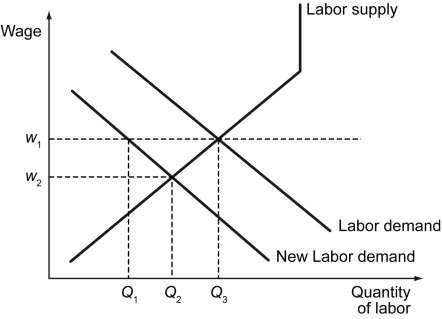
-Refer to the figure above.Assume that instead of shifting to the left,the new demand for labor is shifted to the right of the initial demand for labor.A minimum wage is in effect at w₁.What is likely going to happen due to the shift in the demand for labor?
A) Wages will remain the same because they are set by law.
B) Unemployment will likely increase because of higher wages.
C) Wages will likely decrease because there is greater demand for labor.
D) The market for labor will likely clear at a higher wage rate.
Correct Answer:
Verified
Q195: Collective bargaining can _.
A) reduce wages
B) increase
Q196: Wages that are higher than the current
Q197: The following figure shows curves for labor
Q198: The following figure shows wage versus labor
Q199: The following figure shows wage versus labor
Q201: Efficiency wages _.
A) can lead to wage
Q202: Which of the following statements is true
Q203: The following figure shows curves for labor
Q204: The following figure shows the labor demand
Q205: What is downward wage rigidity?
Unlock this Answer For Free Now!
View this answer and more for free by performing one of the following actions

Scan the QR code to install the App and get 2 free unlocks

Unlock quizzes for free by uploading documents