The following figure shows curves for labor demand and labor supply.
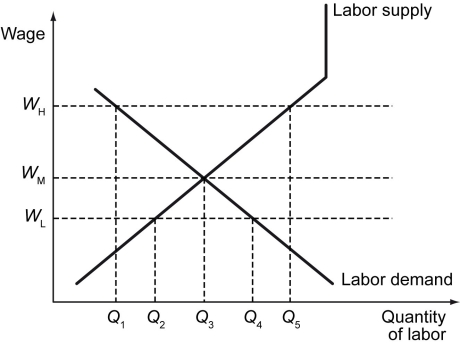
-Refer to the figure above.Why might we observe the wage rate to be at WH rather than at WM?
A) The market clearing wage rate is at WH.
B) By federal law, the minimum wage is set at WL.
C) New technological inventions may have driven up the wage rate.
D) Companies may have found that they can increase their returns from investments in labor by paying the higher wage.
Correct Answer:
Verified
Q204: The following figure shows the labor demand
Q205: What is downward wage rigidity?
Q206: The following figure shows the labor demand
Q207: The following figure shows the labor demand
Q208: Which of the following statements is true?
A)
Q210: The following figure shows the labor demand
Q211: Consider the labor market for farm workers.Suppose
Q212: The following figure shows wage versus labor
Q213: The following figure shows wage versus labor
Q214: Downward wage rigidity arises when _.
A) workers
Unlock this Answer For Free Now!
View this answer and more for free by performing one of the following actions

Scan the QR code to install the App and get 2 free unlocks

Unlock quizzes for free by uploading documents