The following figure shows curves for labor demand and labor supply.
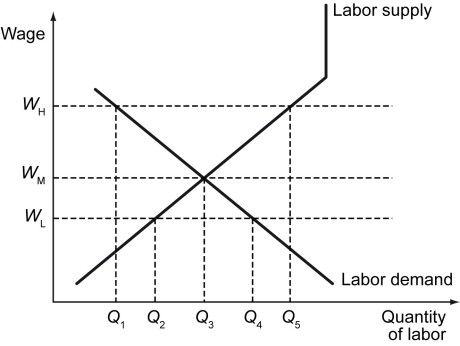
-Refer to the figure above.If a minimum wage law is imposed at WL,the market clearing quantity of labor will change from ________ to ________.
A) Q₃; Q₃ (It will remain unchanged)
B) Q₃; Q₂
C) Q₅; Q₃
D) Q₃; Q₄
Correct Answer:
Verified
Q224: If the natural rate of unemployment in
Q225: The following figure shows wage rate versus
Q226: The following table shows some labor statistics
Q227: Which of the following is true of
Q228: The following figure shows wage rate versus
Q230: The natural rate of unemployment _.
A) is
Q231: The figure below shows labor supply and
Q232: The following figure shows wage rate versus
Q233: The figure below shows labor supply and
Q234: Scenario: Truck drivers across the country are
Unlock this Answer For Free Now!
View this answer and more for free by performing one of the following actions

Scan the QR code to install the App and get 2 free unlocks

Unlock quizzes for free by uploading documents