The following table shows some labor statistics for four years.
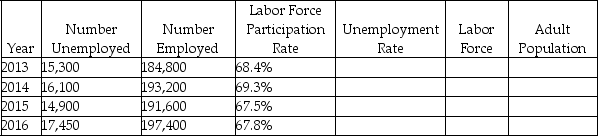
-Refer to the table above.Which year experienced the greatest growth in the labor force from the previous year?
A) 2013
B) 2014
C) 2015
D) 2016
Correct Answer:
Verified
Q237: The following figure shows wage rate versus
Q238: The following table shows some labor statistics
Q239: The following figure shows wage rate versus
Q240: The following figure shows curves for labor
Q241: International trade generally _.
A) leads to lower
Q242: Rapid unemployment increases _.
A) happen in all
Q244: Excessive dependence on cheap foreign imports can
Q245: Shifts in the demand curve of labor
Q246: Areas where whole industries disappear will most
Q247: Areas where whole industries disappear will most
Unlock this Answer For Free Now!
View this answer and more for free by performing one of the following actions

Scan the QR code to install the App and get 2 free unlocks

Unlock quizzes for free by uploading documents